Anatomy of a Program in Memory
You can access the slides 🖼️ for this lecture.
Before analysing the types of attacks that arise from software vulnerabilities and the defences designed to mitigate them, it is essential to understand how programs behave at runtime. Attackers who target low-level system software try to trigger bugs in the program. They then use their deep understanding of how the software behaves to turn such bug-induced malfunctions into real attacks. Hence, on the defence side, if we want to build secure programs and protect software, we need a good understanding of what happens on the CPU and in memory when a program runs.
The Virtual Address Space
Each program sees the memory it can access as a very large array of bytes, the address space. Each slot in this array has an address, from 0 to ~256 TB on modern 64-bit CPUs. The program accesses memory with load and store instructions at target addresses. On Linux the OS kernel is mapped in the address space of each running program, and reserves the upper half of that address space for itself. That leaves the lower 128 TB for the program: it is free to perform load and store operations anywhere in that area.

Virtual Memory. Virtual memory allows creating such a very large address space independently of the amount of RAM that the computer is equipped with. Each program running on the system also gets its own, private address space, and is free to perform loads/stores anywhere in the lower half of that address space without disturbances from other programs: without establishing any form of communication, programs do not see each other’s address spaces.
To achieve these goals, virtual memory performs address translation: after virtual memory is enabled very early in the boot process, any address used by the CPU to index a load/store operation will be a virtual address. Virtual addresses are mapped by the memory management unit (MMU) to physical addresses that index the actual RAM of the computer. This mapping is realised on modern processors with a data structure called the page table:
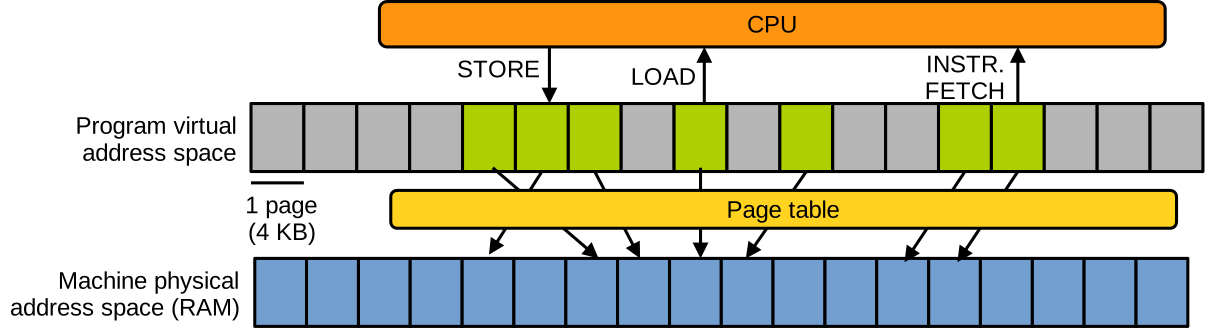
The mapping is realised at the granularity of a page (4 KB). Each program running on the system gets its own page table defining a different mapping, making sure no physical page is mapped into the address spaces of two different programs. The page table also allows the virtual address space to be sparsely populated: most virtual pages are not mapped to physical memory.
Virtual Address Space Life Cycle
How does the address space evolve during the execution of a program? Part of it is set up at load time, when the program is invoked, and before it starts executing. Part of the address space also evolves and changes at runtime.
When a program is invoked (e.g., the user types ./inspect-me on the command line), the operating system first creates a virtual address space for the program’s execution.
Before the program can run, its binary must be loaded inside that address space.
The program’s binary lives somewhere on the computer’s disk.
The binary is in a particular format (for Linux it is ELF, which stands for Executable and Linkable Format).
The format’s metadata embedded in the binary indicate what tool should be used to bootstrap the address space: this is called the loader.
The loader is a separate binary from the program we want to execute, and on modern Linux distributions it is generally named after a variant of ld-linux.so.
Once the loader is identified, the OS loads the loader by mapping parts of its binary (loader code and data) in the address space:
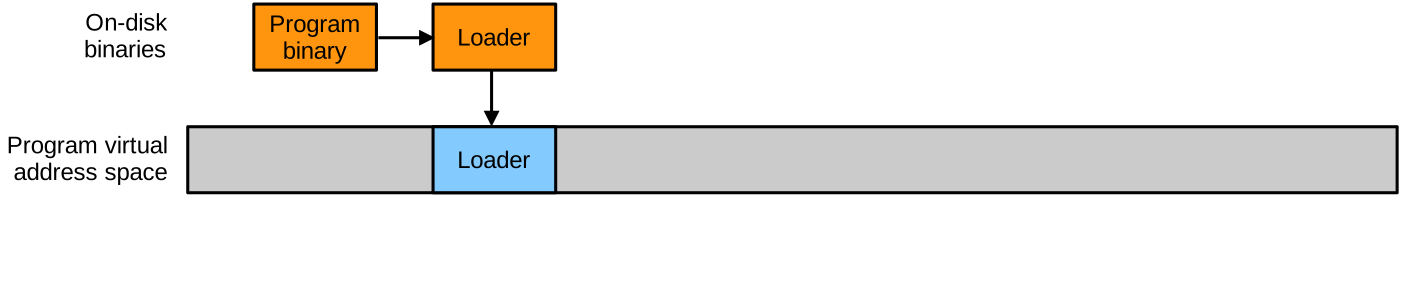
We can inspect the ELF metadata for a particular program binary with the readelf tool.
For example, to see information about the loader required to run the program ls:
$ readelf -l /bin/ls
...
      [Requesting program interpreter: /lib64/ld-linux-x86-64.so.2]
...
Once the loader is loaded, it starts to execute, reads more ELF metadata from the program’s binary, and with that information it can load the program’s binary into the address space:
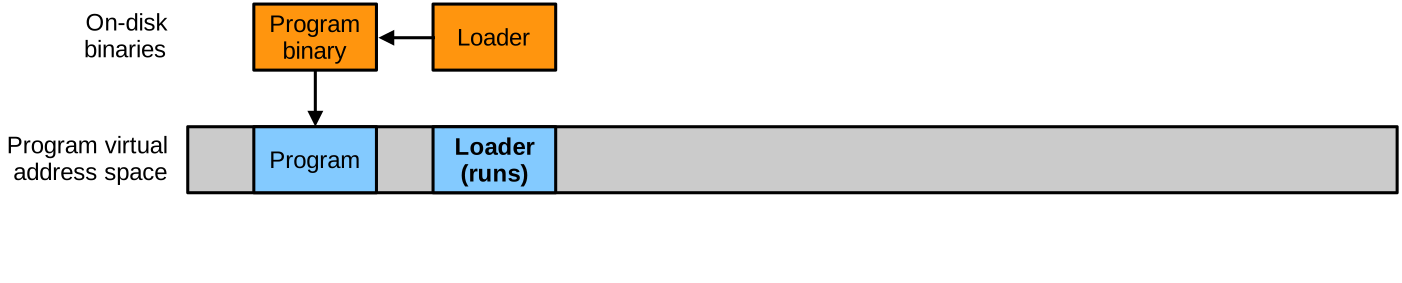
Most programs are dynamically linked: loading their binary alone is not sufficient to prepare their execution, and they require additional libraries to be loaded.
Most libraries today, on operating systems like Linux or Windows, are called shared libraries, as they can be loaded into the address spaces of several programs.
The C standard library is itself available by default as a shared library (libc.so).
The loader fetches the list of libraries required for the program’s execution from the ELF metadata of the program’s binary.
$ ldd /bin/ls
	linux-vdso.so.1 (0x00007f847f8eb000)
	libcap.so.2 => /usr/lib/libcap.so.2 (0x00007f847f871000)
	libc.so.6 => /usr/lib/libc.so.6 (0x00007f847f600000)
	/lib64/ld-linux-x86-64.so.2 => /usr/lib64/ld-linux-x86-64.so.2 (0x00007f847f8ed000)
We can see that ls requires a few shared libraries, including the C standard library and the loader.
When the shared library dependencies are identified, the loader loads the corresponding binaries into the address space:
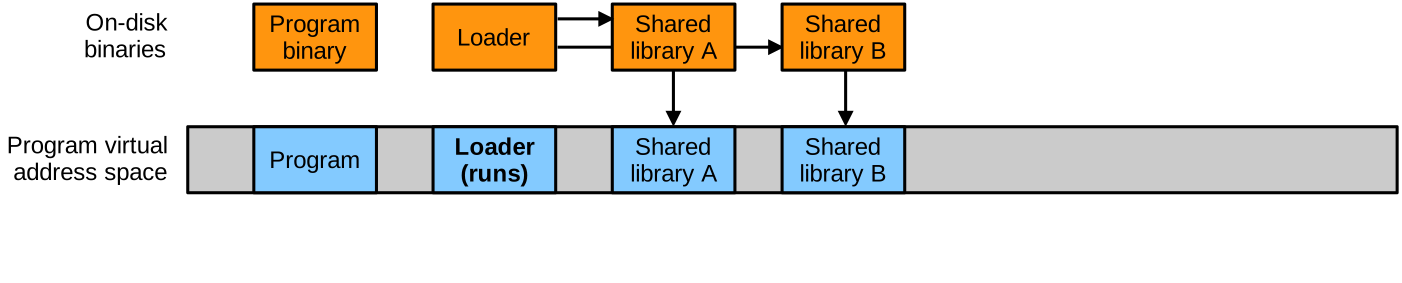
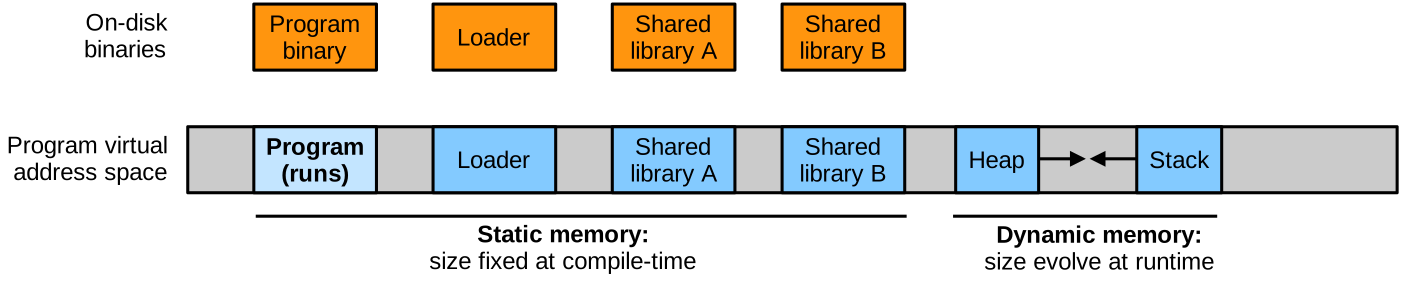
Static Memory. At that stage the program is ready to run, and all the memory set up in the address space is called static memory. The term static comes from the fact that the sizes of these areas (space reserved for the data/code they contain) are fixed at compile time, and will not change throughout the program’s entire execution. Static memory mostly includes executable code and global variables. When static memory is set up, the program can start to execute.
Dynamic Memory. As it runs, the program will also need dynamic memory, i.e. areas whose sizes are not known at compile time and will evolve at runtime. The program needs a stack that will handle function calls and returns. The stack is a contiguous area of memory used to hold function arguments, local variables, function return values and return locations in the code. With each function call, the stack grows, and it shrinks when a function returns. On most architectures the stack grows down, i.e. from high to low addresses.
A second important area of dynamic memory is the heap.
This is where memory allocated dynamically with malloc lives.
The way the heap grows/shrinks can differ depending on the implementation: it either grows upwards towards higher addresses, or it can correspond to an area that is not necessarily contiguous and spread over the address space.
Dynamic memory also includes other mappings made at runtime in the virtual address space: these can be file mappings (e.g., dynamically loaded modules), executable areas for just-in-time compiled code, etc. Static and dynamic memory areas can be illustrated in our example as follows:
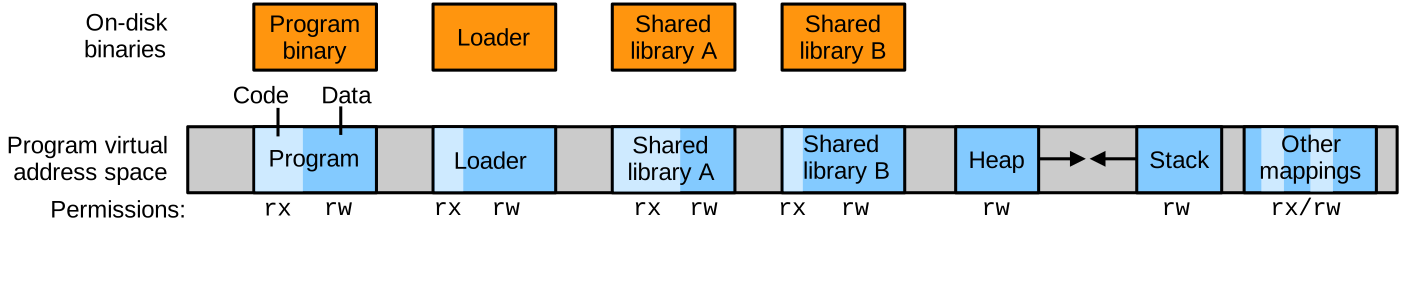
All the areas of the virtual address space have access permissions. These permissions are set up by the OS and enforced by the CPU on each load and store operation. Code areas are generally set to be executable and possibly readable, while data areas are set to be readable and writable or possibly read-only, etc.
Memory Map of a Process
On Linux, the /proc pseudo-filesystem provides a convenient way to inspect operating system-level information about running programs, including their memory maps.
An executing program’s memory map lists the areas of the program’s virtual address space that are mapped to physical memory, their location, permissions, etc.
To inspect a program’s memory map, simply display the file /proc/<program's PID>/maps:
$ cat /proc/21184/maps
564870330000-564870331000 r--p 00000000 103:04 35652325  /home/pierre/prog
564870331000-564870332000 r-xp 00001000 103:04 35652325  /home/pierre/prog
564870332000-564870333000 r--p 00002000 103:04 35652325  /home/pierre/prog
564870333000-564870334000 r--p 00002000 103:04 35652325  /home/pierre/prog
564870334000-564870335000 rw-p 00003000 103:04 35652325  /home/pierre/prog
56489d9a4000-56489d9c5000 rw-p 00000000 00:00 0          [heap]
7f6b9ec32000-7f6b9ec35000 rw-p 00000000 00:00 0
7f6b9ec35000-7f6b9ec5b000 r--p 00000000 103:04 27004964  /usr/lib/x86_64-linux-gnu/libc.so.6
7f6b9ec5b000-7f6b9edb0000 r-xp 00026000 103:04 27004964  /usr/lib/x86_64-linux-gnu/libc.so.6
7f6b9edb0000-7f6b9ee03000 r--p 0017b000 103:04 27004964  /usr/lib/x86_64-linux-gnu/libc.so.6
7f6b9ee03000-7f6b9ee07000 r--p 001ce000 103:04 27004964  /usr/lib/x86_64-linux-gnu/libc.so.6
7f6b9ee07000-7f6b9ee09000 rw-p 001d2000 103:04 27004964  /usr/lib/x86_64-linux-gnu/libc.so.6
7f6b9ee09000-7f6b9ee16000 rw-p 00000000 00:00 0
7f6b9ee2e000-7f6b9ee30000 rw-p 00000000 00:00 0
7f6b9ee30000-7f6b9ee31000 r--p 00000000 103:04 27004961  /usr/.../ld-linux-x86-64.so.2
7f6b9ee31000-7f6b9ee56000 r-xp 00001000 103:04 27004961  /usr/.../ld-linux-x86-64.so.2
7f6b9ee56000-7f6b9ee60000 r--p 00026000 103:04 27004961  /usr/.../ld-linux-x86-64.so.2
7f6b9ee60000-7f6b9ee62000 r--p 00030000 103:04 27004961  /usr/.../ld-linux-x86-64.so.2
7f6b9ee62000-7f6b9ee64000 rw-p 00032000 103:04 27004961  /usr/.../ld-linux-x86-64.so.2
7ffd9db2f000-7ffd9db50000 rw-p 00000000 00:00 0          [stack]
7ffd9dba3000-7ffd9dba7000 r--p 00000000 00:00 0          [vvar]
7ffd9dba7000-7ffd9dba9000 r-xp 00000000 00:00 0          [vdso]
Each entry includes the start and end addresses of the corresponding area in the virtual address space.
Many entries are file mappings, and correspond to binaries being loaded in the address space.
We can identify the running program’s binary (prog), the C standard library (libc.so.6) and the loader (ld-linux-x86-64.so.2).
These all correspond to static memory.
Regarding dynamic memory, we can identify the stack and the heap.
Each area has a set of access permissions such as read (r), write (w), and execute (x).
Regions marked r-x typically correspond to executable code regions of the program or shared libraries.
Writable and read-only regions hold data.
Loading Process, Static Memory
If we zoom in on the loading process for an ELF binary (main program, loader, or shared libraries), the on-disk binary file’s content is divided into sections. When the binary is loaded, contiguous sections with similar permissions form segments that are mapped in the address space:
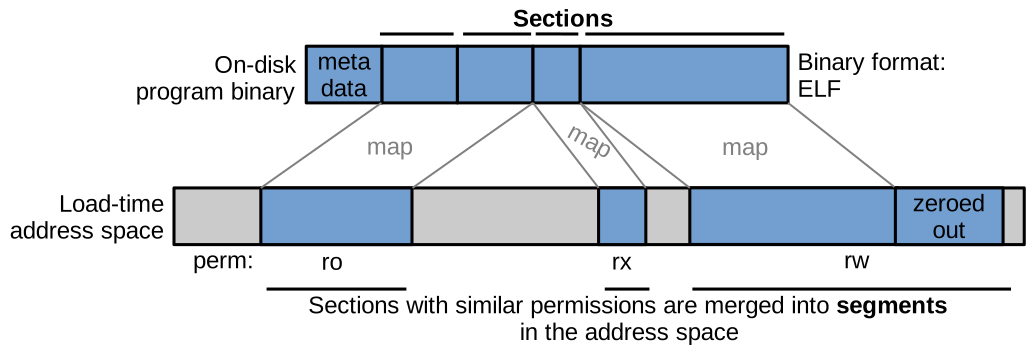
This mapping corresponds in essence to copying the content of the section into memory at the relevant location in the address space, and setting up the proper permissions: this is generally realised with the mmap system call.
Private mappings are used for the ELF binaries, meaning that stores by the program in writable areas will not be reflected in the binaries on disk.
After load time, other mappings will be created at runtime, for example to hold the heap and the stack.
These are anonymous mappings, meaning they are not backed by any file.
We can inspect an ELF binary with readelf to see the sections it contains and the segments that will be created in the address space at runtime:
$ readelf -lSW inspect-me
There are 31 section headers, starting at offset 0x36f8:

Section Headers:
  [Nr] Name              Type            Address          Off    Size   ES Flg Lk Inf Al
  [15] .text             PROGBITS        0000000000001070 001070 00011f 00  AX  0   0 16
  [17] .rodata           PROGBITS        0000000000002000 002000 000008 00   A  0   0  4
  [25] .data             PROGBITS        0000000000004018 003018 000010 00  WA  0   0  8
  [26] .bss              NOBITS          0000000000004028 003028 000008 00  WA  0   0  1

...

Program Headers:
  Type           Offset   VirtAddr           PhysAddr           FileSiz  MemSiz   Flg Align
  LOAD           0x000000 0x0000000000000000 0x0000000000000000 0x000688 0x000688 R   0x1000
  LOAD           0x001000 0x0000000000001000 0x0000000000001000 0x000199 0x000199 R E 0x1000
  LOAD           0x002000 0x0000000000002000 0x0000000000002000 0x0000e0 0x0000e0 R   0x1000
  LOAD           0x002dd0 0x0000000000003dd0 0x0000000000003dd0 0x000258 0x000260 RW  0x1000

...

 Section to Segment mapping:
  Segment Sections...
   03     .init .plt .plt.got .text .fini
   04     .rodata .eh_frame_hdr .eh_frame
   05     .init_array .fini_array .dynamic .got .got.plt .data .bss
readelf prints for each section its offset (Off, location of the start of the section on disk), its size, permissions (Flg, with X for executable and W for writable), and other information such as alignment constraints.
Similar information is available for segments, with their location and size in the address space (VirtAddr and MemSiz), along with permissions and alignment information.
Finally, readelf also outputs the list of sections composing each segment: you can confirm that it is always sections with similar permissions that are merged together into a segment.
The Code Segment
The code segment for a loaded binary contains the machine code to be executed by the CPU for the corresponding program/library.
It is possible to see the content of the code segment for a binary by disassembling it.
We can illustrate that with an example.
Consider this C program, inspect-me.c:
#include <stdio.h>
#include <unistd.h>

int main(int argc, char **argv) {
    while(1) {
        printf("%d\n", getpid());
        sleep(1);
    }
    return 0;
}
We can compile inspect-me.c into the ELF binary inspect-me and disassemble it:
$ gcc inspect-me.c -o inspect-me
$ objdump --disassemble inspect-me

...

0000000000001159 <main>:
    1159: push   %rbp
    115a: mov    %rsp,%rbp
    115d: sub    $0x10,%rsp
    1161: mov    %edi,-0x4(%rbp)
    1164: mov    %rsi,-0x10(%rbp)
    1168: call   1030 <getpid@plt>
    116d: mov    %eax,%esi
    116f: lea    0xe8e(%rip),%rax
    1176: mov    %rax,%rdi
    1179: mov    $0x0,%eax
    117e: call   1040 <printf@plt>
    1183: mov    $0x1,%edi
    1188: call   1050 <sleep@plt>
    118d: jmp    1168 <main+0xf>
What we see here are the x86-64 machine instructions making up the code for the main function.
The hexadecimal number before each instruction is the offset at which that instruction is located in the binary’s code section.
Function Calling Convention
While we are looking at machine code, an important thing to know in order to understand this week’s content is: which assembly instructions are executed upon function calls and returns. The concept of a “function” does not really exist at the machine code level: if you disassemble a program compiled from a source file having multiple functions, you will see that all the functions’ code is merged into the code segment.
At compile time, the compiler generates the machine code for function calls and returns according to an architecture-specific calling convention. For x86-64, the convention used for Linux is the System V x86-64 Application Binary Interface (ABI). The convention states that the machine code implementing function calls and returns should follow these rules:
- Upon a function call, the calling function (caller) first places its arguments, in order, in the registers
%rdi,%rsi,%rdx,%rcx,%r8, and%r9(these are x86-64 general-purpose registers). It then issues thecallinstruction, which makes the CPU jump to the first instruction of the called function (callee) in the code segment.- If the callee has more than 6 parameters, additional parameters are pushed on the stack.
- When a function returns, the callee places the return value in the
%raxregister and executes theretinstruction: the CPU jumps back to the next instruction following thecallin the caller.
Anatomy of a Function Call.
If we study the machine code obtained by disassembling inspect-me above and look at the invocation of the getpid and printf functions within main, we have the following assembly instructions:
1168: call   1030 <getpid@plt>
116d: mov    %eax,%esi
116f: lea    0xe8e(%rip),%rax
1176: mov    %rax,%rdi
...
117e: call   1040 <printf@plt>
We can see the following happening:
1168:getpidtakes no argument, so it can be called directly with acallinstruction116d: the return value ofgetpidis in%rax; it is moved into%esi(%eaxand%esiare the lower 32 bits of the 64-bit registers%raxand%rsi): this is the preparation of the second argument for the upcoming call toprintf116fand1176: the address of the string"%d\n"is loaded into%rax(it is computed as the offset0xe8efrom the current instruction pointer), then moved into%rdi: this is the preparation of the first argument for the upcoming call toprintf117e:printfis called with acallinstruction
Anatomy of a Function Return. An important concept for this week’s content is: how does the CPU know where to jump back to when returning from a function call? Similar to what we saw with a function call, let’s study what happens at the machine code level when a function returns. Consider the following code:
int f(int param) {
  int f_local = 0xcafe;
  /* ... */
  return 0x33;
}

int main() {
  int main_local = 0x42;
  int ret = f(main_local);
  /* ... */
}
Compiled and disassembled, we see the following:
0000000000001139 <f>:
  1139:	55                   	push   %rbp
  113a:	48 89 e5             	mov    %rsp,%rbp
  113d:	89 7d ec             	mov    %edi,-0x14(%rbp)
  1140:	c7 45 fc fe ca 00 00 	movl   $0xcafe,-0x4(%rbp)
  1147:	b8 33 00 00 00       	mov    $0x33,%eax ; 6. return value placed in %rax
  114c:	5d                   	pop    %rbp       ; 7. return from f into main
  114d:	c3                   	ret

000000000000114e <main>:
  114e:	55                   	push   %rbp
  114f:	48 89 e5             	mov    %rsp,%rbp
  1152:	48 83 ec 10          	sub    $0x10,%rsp
  1156:	c7 45 f8 42 00 00 00 	movl   $0x42,-0x8(%rbp)  ; 1. main_local = 0x42;
  115d:	8b 45 f8             	mov    -0x8(%rbp),%eax   ; 2. 0x42 loaded in %rax
  1160:	89 c7                	mov    %eax,%edi         ; 3. 0x42 moved to %rdi
  1162:	e8 d2 ff ff ff       	call   1139 <f>          ; 4. call f
  1167:	89 45 fc             	mov    %eax,-0x4(%rbp)   ; 5. store return value in ret
  116a:	b8 00 00 00 00       	mov    $0x0,%eax
  116f:	c9                   	leave
  1170:	c3                   	ret                      ; 8. return from main
We can see that the System V convention we described earlier is well followed: before calling f, main prepares its argument by placing 0x42 into %edi.
f is called with a call instruction.
Inside f, when it is time to return to main, the return value 0x33 is placed into %rax, and the return is made with a ret instruction.
When f returns, main places the return value in a local variable and then returns itself with a ret instruction.
Compare the invocation of the call and ret instructions and consider where does the CPU need to jump?
For calls, it is easy: there is always a single target address in the code segment, as we always call a particular function; for example, when main calls f, the CPU jumps to offset 0x1139.
For ret things are a bit more complicated because a function can be called from many different locations in a program, so there is no single return point and the compiler can’t embed a single return address in the code like it does with call.
The return address is actually pushed on the stack upon each function call.
Function Calls and the Stack
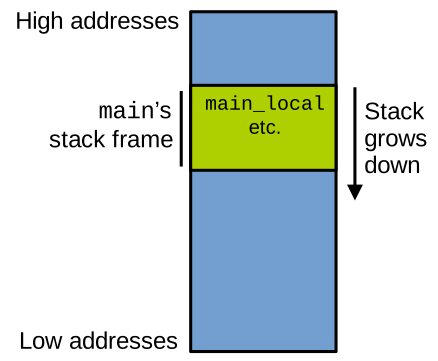
We have seen that the stack is a contiguous area in the address space that holds per-function data, e.g., parameters and local variables.
Each function has a stack frame on the stack: an area of contiguous memory dedicated to holding information and data for that particular function.
With our example, when main runs, before it calls f the stack looks like this:
When main calls f, it executes the call instruction.
As a result the CPU:
- Pushes the return address (the location in
mainwhere execution should resume) on the stack; and - Jumps to the target function
f.
Then f starts to run and allocates a frame for itself on the stack.
At that stage, the stack looks as follows: main’s frame, followed by the return address for the call to f, followed by f’s frame:
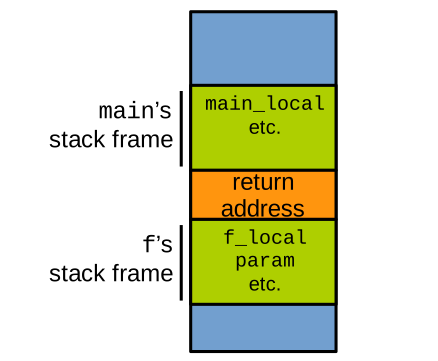
When f is done, it discards its stack frame and returns to main by executing the ret instruction.
As a result the CPU:
- Pops the return address from the stack; and
- Jumps to it.
main can continue to execute, starting at the next instruction after the call.
This way, even if functions can be called from multiple locations in the program, including in a nested manner, the CPU always knows the proper location in the code where to jump back when a function returns.